Why are there so many PIRs? In Defense of the Defect Ratio
By Christina Kalinowski on Mon, May 02, 2016


In a perfect world, a newly implemented software system would go-live with no PIRs (Problem Incident Reports). And everything would look and function exactly how the client had envisioned - flawlessly. Surely, an understandable aspiration; however, let’s look at whether or not that is a realistic expectation.
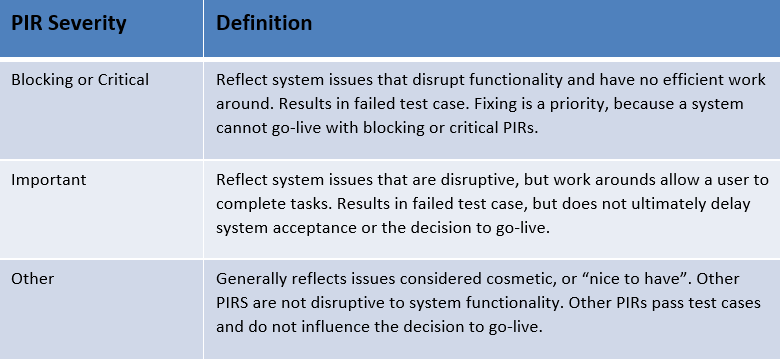
It’s not difficult to understand a client’s concern when faced with a rapidly approaching go-live date when there are still a number of unresolved PIRs. And let’s not forget the PIRs being discovered daily as User Acceptance Testing (UAT) commences. It’s easy to fixate on the sheer number of unresolved PIRs and overlook their severity (see Table 1).
A hard number fails to provide important details, such as how disruptive a particular PIR is to system functionality. Does the PIR prevent the user from completing a process? Or is the PIR simply cosmetic, as in a request to alter the name of a field on a particular screen?
Let’s take a step back for a second. What exactly is a PIR? A PIR is the observation and subsequent classification of a type of system ‘misbehavior’. PIRs include things like misspelled field names, requests to hyperlink a piece of data to navigate a user to a specified destination, and the failure to perform a calculation correctly. PIRs can also be mistakenly reported, as when a system tester misunderstands how a test case should be executed and reports it as a defect.
Table 1. PIR Severity Levels, Defined

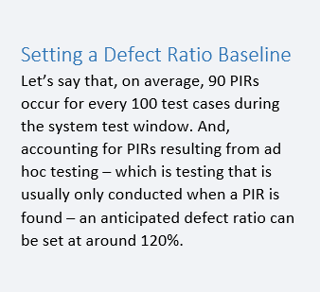
Let’s pretend that you’re about six months or so from going live. Out of the 2,500 reported PIRs, 500 remain unresolved. That’s an intimidating number. But what the number fails to tell us is how many of those PIRs are critical/blocking.
Enter the defect ratio.
A defect ratio is a formula used to show the number of PIRs per the number of test cases, expressed as a percentage:
Number of defects
Number of test cases = Defect ratio
The defect ratio paints a more accurate picture of the remaining work needed than a static number does.
 For simplicity’s sake, let’s say that the remaining 500 PIRs defects were discovered/reported out of 450 test cases.
500 / 450 = 111% (approximately)
While any number over 100% may seem scary, when you break down the percentage by severity levels, it becomes less so.
Let’s say that 150 of the PIRs are critical/blocking.
150 / 450 = 33% (approximately)
Considerably less scary of a percentage, right?
Taking it one-step further, you can examine the results by functional module, exemplified in the table below.
Table 2. Defect Ratio per Functional Module (all PIR severity levels)

So why does the defect ratio matter? Glad you asked. A defect ratio is a great tool for setting client expectations. And it provides you and your team with reasonable project goals. Selecting an arbitrary number at the outset just isn’t feasible as the number of resulting PIRs varies from project to project. Stating that a maximum of 100 non-critical PIRs can be unresolved upon go-live is a great goal for a project that has 1,000 PIRs, but is perhaps overly ambitious for one that winds up having 3,000.
Stating that go-live will occur with no more than 10% non-critical PIRs is a realistic expectation, one that accommodates projects of varying sizes. Using the previous example, if a project winds up with 3,000 PIRs, at a 10% defect ratio, 300 non-critical PIRs can be unresolved upon go-live. The defect ratio serves as a means to weight projects that might be very different in size and scope relatively equally in terms of PIRs.
Further, the defect ratio also provides a means for an organization to assess their performance. Since PIRs encountered vary across clients, calculating defect ratios across individual functional modules provides a means for an organization to do so. Sort of like comparing apples to apples, instead of apples to oranges. Benefit Calculation is an example of a functional module that is present across benefit administration projects. For Benefit Calculation, let’s say that the defect ratio for Client A is 145%, 120% for Client B, and 50% for Client C. While the ratio between them may initially seem significant, averaging the defect ratios reveals an average defect ratio of 105%.
The Take-AwayWhile this is admittedly an oversimplification of the defect ratio, its power as a multifaceted tool is undeniable. The defect ratio allows you to set realistic expectations for clients, expose the flaws of viewing PIRs in terms of static numbers, and is useful as a self-evaluation tool to examine a company’s performance.
About Sagitec Solutions:
Sagitec Solutions, LLC designs and delivers tailor-made pension, provident fund, and unemployment insurance software solutions. With broad industry experience, Sagitec helps their customers achieve strategic business objectives, enhance service offerings, and lower operating costs. In addition to their offices in India, Sagitec also has offices in Minneapolis, MN, Topeka, KS, Denver, CO, and Oakland, CA. They are headquartered in the Twin Cities area of Minnesota. Further information can be found at http://www.sagitec.com or by contacting Rick Deshler at (651) 335-3406 or at rick.deshler@Sagitec.com.
Considering a new line-of-business solution? Take our free pension system assessment and receive a customized report that contains an evaluation of your current pension administrative software along with key recommendations for improvement.
You May Also Like
These Related Stories

Don't Forget Your Pants: Thoughts on Managing Change in the Face of New Technology Solutions

Sagitec is helping their public pension clients implement defined contribution plans


No Comments Yet
Let us know what you think