Application performance management, including monitoring and logging, are critical success factors for almost any IT shop. The problem is that many of the tools available on the market to provide you with insights into the root cause of an issue are expensive and need a good data feed from the native application to work well.
In the current computing world, transactions typically span multiple devices like firewall, routers, servers, and software like windows OS, Neospin™ pension software (if you are a Sagitec client), Entrust, FileNet, and more. When problems occur, it is hard to quickly pinpoint the device or the software where it originated and propagated. Most devices generate their own logs and commercial logging appliances have the capability to ingest feeds from different sources and provide a consolidated time-based view of the transactions processed. However, these logging interfaces are built to serve network and systems administrators and can contain sensitive firewall and network information.
Our conversations with existing clients in our Technical Advisory board, User Community, and other on-site discussions showed us that clients, including the ones with commercially available logging devices, felt the need for much more granular logging information from Neospin™. Upon further feature analysis, Sagitec decided to significantly bolster both the NeopsinTM logging and real-time application monitoring functionality to benefit all of our clients (both current and future). These enhancements provide deeper insight into Neospin™ transactions, from the web server to the Neospin™ database. Clients without commercial logging products cannot monitor Neospin™ end-to-end. Clients utilizing commercial products will find the enhancements and the feeds more useful and granular than ever before. If needed, it enables the separation of duties protocol between an Infrastructure/network engineer and a Neospin™ administrator.
End-To-End Application Tracing Feature in Sagitec’s Framework 6.0
Sagitec’s newest available framework, 6.0, provides comprehensive application monitoring and tracing functionality that can be used to monitor the Neospin™ application at the detailed level our clients require or can be tied into other helpful tools like Splunk to provide you with better data points than you have access to today.
End-to-end application tracing identifies the source of an excessive workload and identifies slow response transactions at the web, application, and database, and rule level.
In a multi-tier environment, the web tier routes a request from an end client to different application servers, making it difficult to track a client’s actions in the system. The end-to-end application tracing simplifies diagnosing performance problems in single or multitier environments. The end-to-end application
Here are some interesting facts about our tracing functionality:
- You can turn your application monitoring on or off
- You can define the threshold time limits for business transactions, application server, query, and rules execution
- You can configure tracing for a specific portal (without enabling it for other portals) and/or your internal line-of-business solution
- You can configure the logging level for any given portal and/or for a specific user within a portal. Our application
tracing feature enables you the flexibility to trace events in the past or future.
The system collects statistics based on tracing configuration. The application system administrator starts getting insights into the user activities and business activities’ tracing information. The application system administrator is provided with a facility to:
- Search user activity steps based on time period, IP address, and session ID
- Search business transaction based on time period, IP address, and Session ID
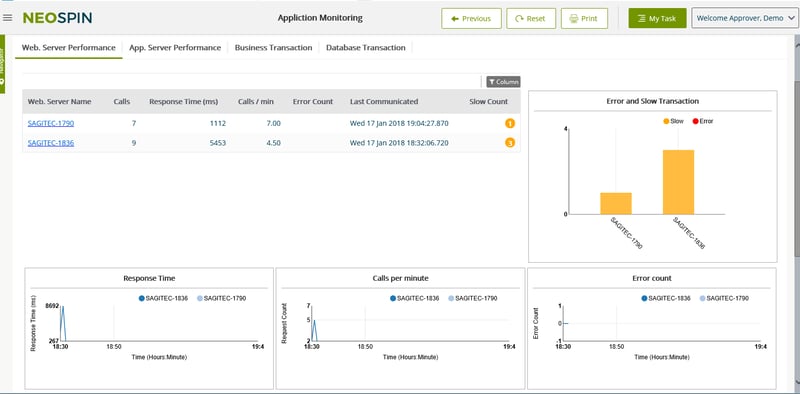
Application Performance Monitoring Feature in Sagitec’s Framework 6.0
The performance monitoring feature identifies potential performance problems before they impact end users. Performance monitoring assists System Administrators to establish performance baselines and automatically identifies anomalies.
The following are notable features provided for application performance monitoring in Sagitec’s Framework 6.0:
- Provides a statistical view of web server performance like average response time, transaction throughput, slow transaction, and error counts for each web server
- Provides a statistical view of application server performance like average response time, transaction throughput, slow transaction, and error counts for each web server
- Depicts the top 10 slow running transactions in the system
- Points to the top 10 slow running SQL queries in the system
- Filters the time period based on the end-user requirement
The benefits of these features include providing visibility into the activities in the application and improves product quality and reliability.
Sagitec has gone to great lengths to formalize the intake of client feedback and ideas in order to elicit and drive the voice of the customer into all of our products and services through the Sagitec User Community, Technical Advisory board, and our continuing focus on innovation. With our product updates, we are better able to identify the specific needs and requirements of multiple clients and drive those requirements into action. Our monitoring and logging functionality in 6.0 is one great example of how we’ve been able to do this.
Do you want to know more about how Sagitec monitors application performance? Click the link below.